IO
The synkit.IO module provides tools for converting chemical reaction representations between various formats:
Reaction SMILES / SMARTS
ITS (Internal Transformation Sequence) Graph
GML (Graph Modeling Language)
Aldol Reaction Example
Below is the aldol condensation between an aldehyde and a ketone:
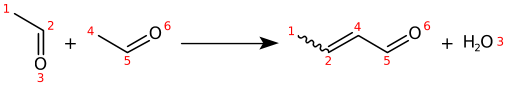
Figure: Aldol condensation between an aldehyde and a ketone.
Conversion to Reaction SMARTS
Use rsmi_to_rsmarts to transform a reaction SMILES into a reaction SMARTS template:
 1from synkit.IO import rsmi_to_rsmarts
 2
 3template = (
 4    '[C:2]=[O:3].[C:4]([H:7])[H:8]'
 5    '>>'
 6    '[C:2]=[C:4].[O:3]([H:7])[H:8]'
 7)
 8
 9smart = rsmi_to_rsmarts(template)
10print("Reaction SMARTS:", smart)
11# Reaction SMARTS: "[#6:2]=[#8:3].[#6:4](-[H:7])-[H:8]>>[#6:2]=[#6:4].[#8:3](-[H:7])-[H:8]"
Conversion to ITS Graph
Use rsmi_to_its to convert a reaction SMILES/SMARTS string into an ITS graph.
Set core=True to restrict to the reaction center only.
 1from synkit.IO import rsmi_to_its
 2from synkit.Vis import GraphVisualizer
 3
 4rsmi = (
 5    '[CH3:1][CH:2]=[O:3].'
 6    '[CH:4]([H:7])([H:8])[CH:5]=[O:6]'
 7    '>>'
 8    '[CH3:1][CH:2]=[CH:4][CH:5]=[O:6].'
 9    '[O:3]([H:7])([H:8])'
10)
11
12# Full ITS graph
13full_graph = rsmi_to_its(rsmi, core=False)
14viz = GraphVisualizer()
15viz.visualize_its(full_graph, use_edge_color=True)
16# >> Figure A: Full ITS graph
17
18# Reaction-center-only ITS graph
19core_graph = rsmi_to_its(rsmi, core=True)
20viz.visualize_its(core_graph, use_edge_color=True)
21# >> Figure B: Reaction-center ITS graph
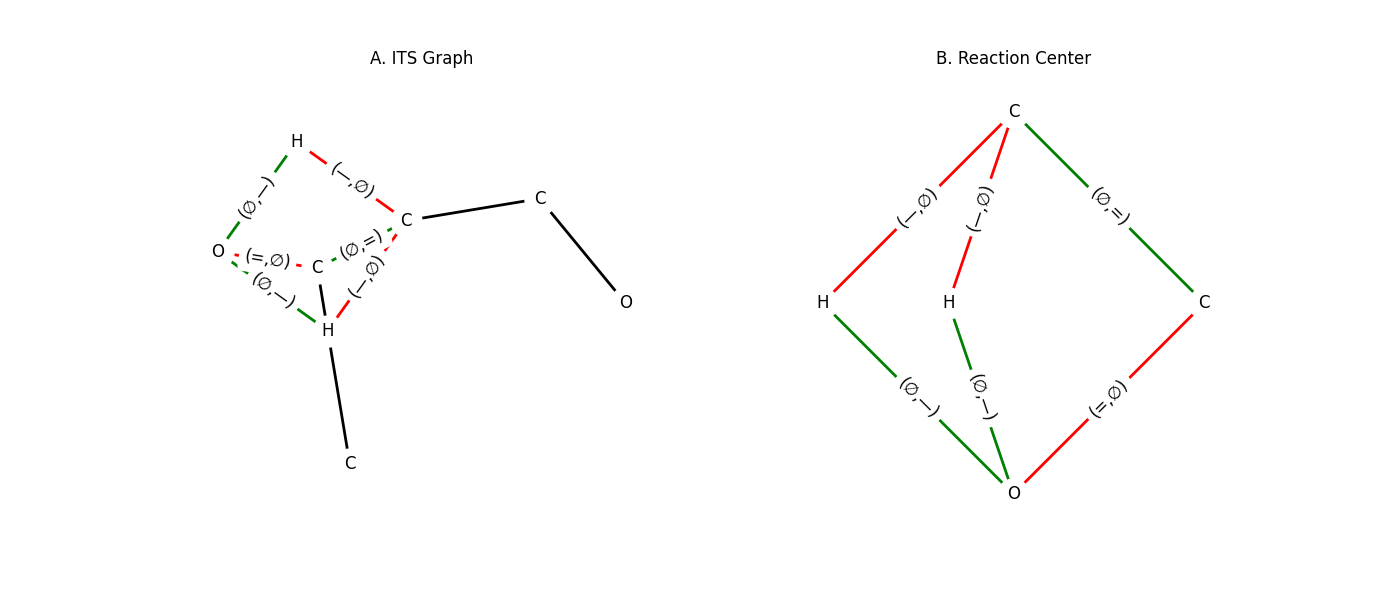
Figure: (A) Full ITS graph and (B) reaction-center-only ITS graph for the aldol condensation.
Conversion to DPO Rule (GML)
Convert a reaction SMARTS (or SMILES) template into a DPO rule in GML format:
smart_to_gml(react_template, core=False, useSmile=False)its_to_gml(its_graph, core=False)
Set core=True to include only the reaction center, and useSmile=True to treat the input as SMILES.
 1from synkit.IO import (
 2   rsmi_to_its,
 3   smart_to_gml,
 4   its_to_gml,
 5   save_text_as_gml,
 6   load_gml_as_text,
 7)
 8
 9# Define the aldol reaction template
10reaction = (
11   '[CH3:1][CH:2]=[O:3].'
12   '[CH:4]([H:7])([H:8])[CH:5]=[O:6]'
13   '>>'
14   '[CH3:1][CH:2]=[CH:4][CH:5]=[O:6].'
15   '[O:3]([H:7])([H:8])'
16)
17
18# Option 1: Direct SMARTS → GML
19gml_rule_1 = smart_to_gml(reaction, core=True, useSmiles=False)
20
21# Option 2: SMILES → ITS → GML
22its_graph = rsmi_to_its(reaction, core=True)
23gml_rule_2 = its_to_gml(its_graph, core=True)
24
25# Save to disk
26save_text_as_gml(gml_text=gml_rule_2, file_path="aldol_rule.gml")
27
28# Load back into text
29loaded_rule = load_gml_as_text("aldol_rule.gml")
30print(loaded_rule)
rule [
  ruleID "aldol_rule"
  left [
    edge [ source 2 target 3 label "=" ]
    edge [ source 4 target 7 label "-" ]
    edge [ source 4 target 8 label "-" ]
  ]
  context [
    node [ id 2 label "C" ]
    node [ id 3 label "O" ]
    node [ id 4 label "C" ]
    node [ id 7 label "H" ]
    node [ id 8 label "H" ]
  ]
  right [
    edge [ source 2 target 4 label "=" ]
    edge [ source 3 target 7 label "-" ]
    edge [ source 3 target 8 label "-" ]
  ]
]
See Also
synkit.Vis— visualization utilitiessynkit.Graph— graph data structures and transformations